In response to a competition run by 360Giving, designers, analysts and data journalists from around the world have been creating new ways to reveal how 24 billion pounds worth of grants have been used.
The 360Giving open dataset, encompassing over 290,000 grants, has been developed to help grantmakers, fund seekers and policy makers make better decisions. A total of 92 funders are sharing their data to the open standard developed by 360Giving.
Philanthropist and 360Giving trustee Will Perrin, explains: ‘We have a staggering amount of data published to the 360 Standard. In a busy world people need a quick and accessible way to grasp what it says. 80% of the information that people take in is visual, so we challenged the global creative community to come up with ways to unlock the value in this open data through visualisations. And we are amazed at the variety and quality of results.’
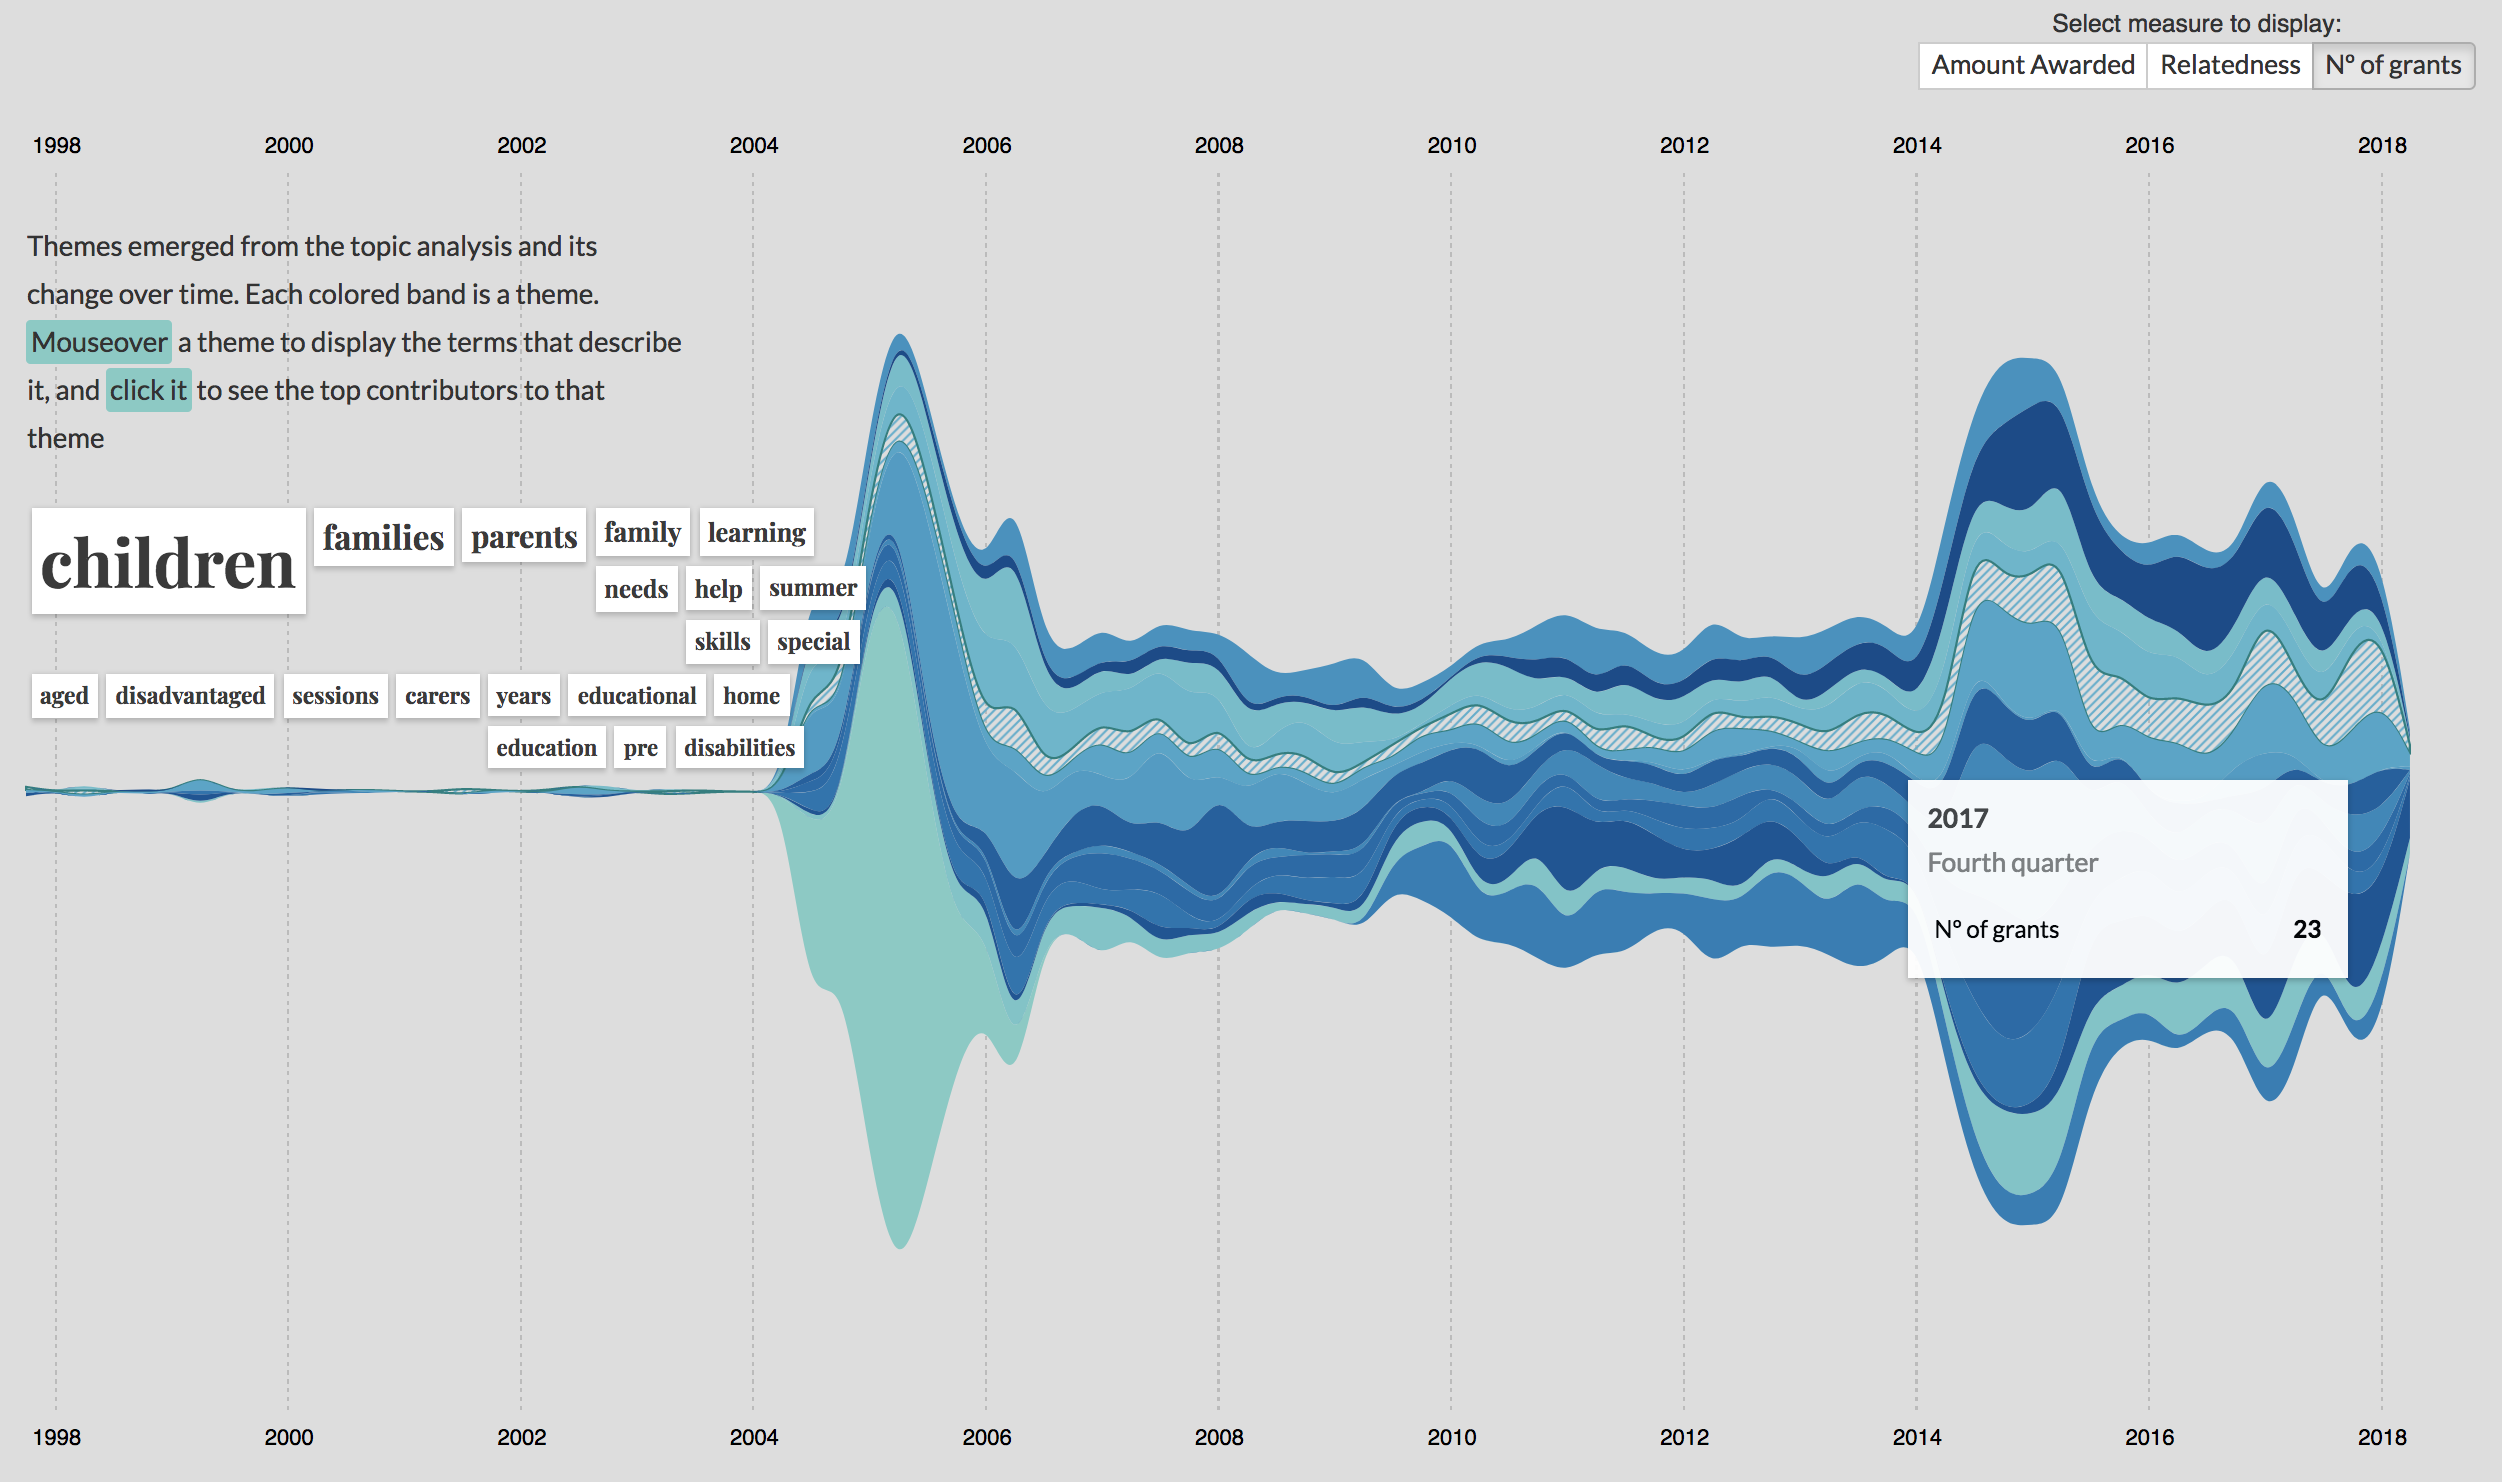
The winners were announced at an awards ceremony in London on 21 September 3018. The overall winner of the competition is Xavi Gimenez, a data visualisation engineer from Barcelona. Xavi used a type of natural language processing to discover the funders of hidden themes from documents and structured data available via 360Giving’s GrantNav platform about grants made since 1998.

Funding of discovered themes, throughout the years: A view to grantmaking activity since 1998 – timeline of the themes, sized by relativeness of its grants, the amount of funding, or the number of grants.
Congratulating Xavi Gimenez for his winning visualisation, Will Perrin, who chaired the judging panel, summed up their verdict: ‘Xavi’s beautiful visualisation allows you to leap right into large complex datasets and understand what’s been funded. Underneath the interactive graphics lies some excellent coding and Xavi’s talent demonstrates the power of open grants data.’

For his creativity, Xavi has been awarded a cash prize of £6,000.
On hearing that he had won the top prize, Xavi said: ‘I had a lot of fun with the dataset, playing with the topics and visualising the data. It was definitely a fruitful exercise. I would like to take this opportunity to congratulate 360Giving for this initiative: the creation of a data standard for the grantmaking sector, the quality of the data and the trust generated in it.’
Another of the judges, Lucy Bernholz, a Senior Research Scholar at Stanford University’s Center on Philanthropy and Civil Society, Director of the Digital Civil Society Lab and Alliance editorial board member, said, ‘From forests of grantmakers to emoji-based trend analysis, the 360Giving data visualisation challenge reveals a creative public interest in even the most basic financial data on philanthropy. Applicants tried many things from topic modeling to scissors and paste to communicate the size, reach, age and interests of grantmakers in the UK. A great start – I hope this visualisation challenge successfully provokes more questions, more data and more engagement with the information.’


Comments (0)